This project was a partnership with the software startup Simple Layers and CVWD (the Crescenta Valley Water District).
The goal of the project was to streamline the process of accessing data, which was previously only available through numerous lengthy Excel spreadsheets and paper maps at their offices,
by combining the numerical data with the graphical data.
This not only makes accessing data more efficient, but also creates a database that is easily accessible by multiple workers at a time.
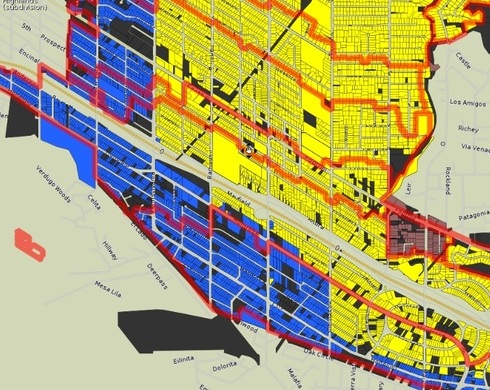
Currently, the data can be accessed by CVWD on an interactive map.
The map has multiple features, where they can click on different areas and parcels of land to retrieve data about the pipeline and maintenance in that area.
The map is color-coded for specific data,
and the user can zoom in on a specific reason which also creates a query for data in that region.